
The Edge Effect


The people responsible for catching problems in healthcare, education, and infrastructure are almost always working on a rotation. They check in, respond to what they find, and move on to the next person or site. That’s not a flaw in the system. It’s how human attention works when one person is responsible for many. But the problems that develop between those visits don’t follow the same schedule. In ecology, the edge effect describes what happens at the boundary between two environments: that’s where the most activity and vulnerability concentrate. Institutions have their own version. The boundary, or period, between one check-in and the next is where patients fall, students get stuck, equipment faults, and wounds change. This issue looks at four stories where AI shows up in those gaps.
62% Fewer Falls in 90 Days: A Phoenix Senior Community Rewires Its Safety Net
Falls in senior living communities follow a grim math. The CDC estimates that 50 to 75% of long-term care residents fall each year, generating more than $50 billion annually in U.S. medical costs. The window between a resident’s first sign of trouble and the fall itself is often too short for anyone on a scheduled rotation to catch.
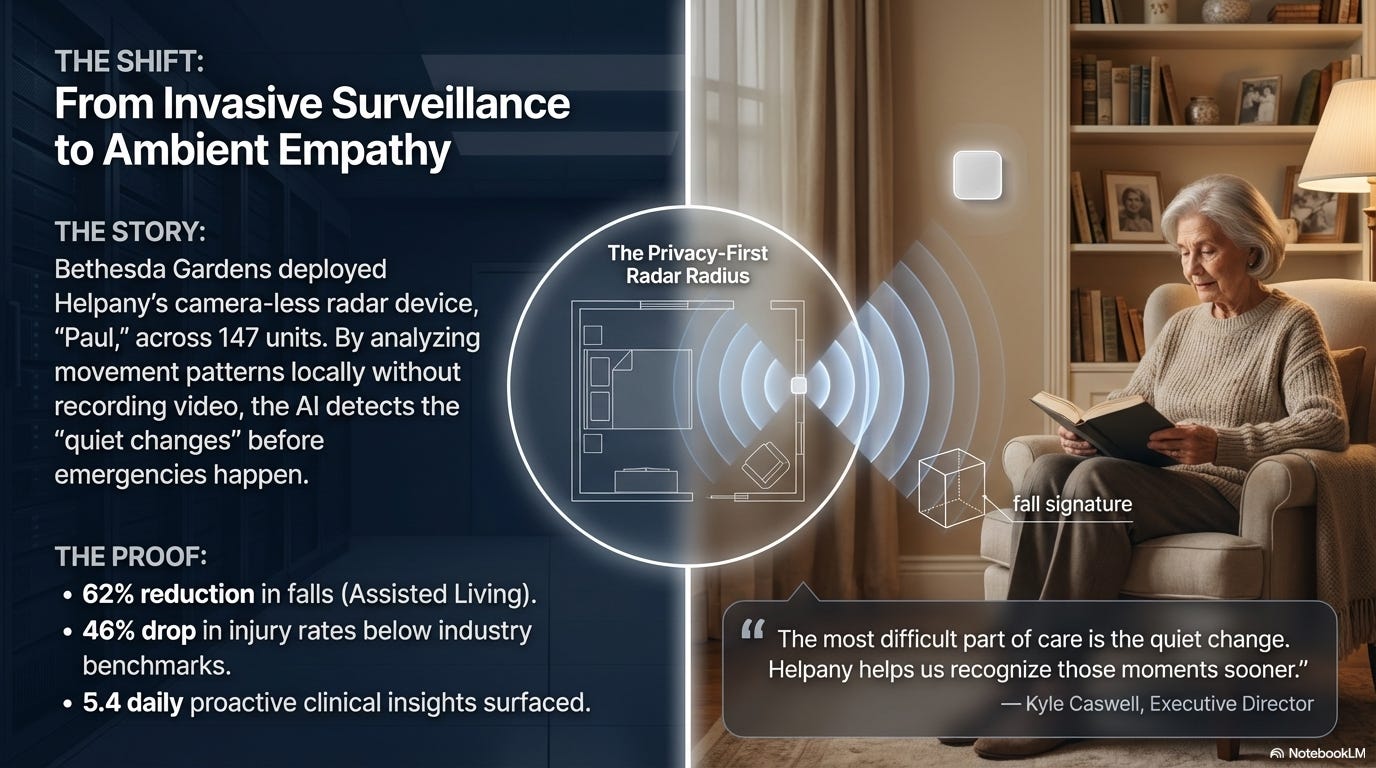
Bethesda Gardens, a faith-based nonprofit senior living community in Phoenix, deployed a radar-based AI monitoring system across all of its assisted living and memory care units, covering up to 147 residents. The device, built by Helpany, tracks movement patterns continuously without cameras, preserving privacy while flagging behavioral changes that precede falls or health deterioration.
Within 90 days, falls dropped 62% in assisted living and as much as 78% in memory care, compared to the previous 12-month averages. Injury rates fell 46% below industry benchmarks. Hospitalizations dropped 53% below national averages.
Bethesda Gardens isn’t the only site reporting these results. Two other Arizona senior living nonprofits using the same system, Fellowship Square Historic Mesa and Westminster Village, reported fall reductions of 80% (measured by fall-related 911 calls) and 72% respectively over similar timeframes. All three organizations operate independently of one another.
The system’s value went beyond fall prevention. Because the radar monitors movement patterns continuously, it can detect behavioral shifts that signal emerging health issues. A resident getting up far more frequently at night may be showing early signs of a urinary tract infection. Changed mobility patterns after a medication adjustment may indicate side effects. Over 90 days, the system flagged 486 such condition changes, an average of 5.4 per day, giving caregivers a chance to intervene before symptoms escalated. Roughly 23% of residents showed gaps between their documented care plans and their actual observed needs, prompting the team to realign how care was being delivered.
A caveat: all three sets of results come from the communities and the vendor, not independent research. The observation windows are 90 days, the sample sizes are small, and no control groups are described. The results are promising, and the consistency across three independent sites is harder to dismiss than a single case. But they haven’t been externally validated. What makes the story worth watching is the scope of what the system surfaced: not just fall prevention, but a continuous picture of resident health that staff couldn’t realistically assemble through periodic check-ins alone.
Article
Fellowship Square Historic Mesa Case Study
Westminster Village Results
Key Stakeholders
Bethesda Gardens Phoenix
Helpany
“Basically a Teacher Online”: Allentown’s AI Chatbot Gets Mixed Reviews from Sixth Graders
A teacher circulating among 30 students can only be in one place at a time. A kid gets stuck on a writing prompt, raises a hand, and waits. By the time the teacher arrives, the moment has passed or the student has moved on to something else. The student isn’t falling behind because the teacher isn’t good enough. The structure of a classroom with one instructor and 30 learners means help arrives on a rotation, and learning doesn’t wait for the rotation.
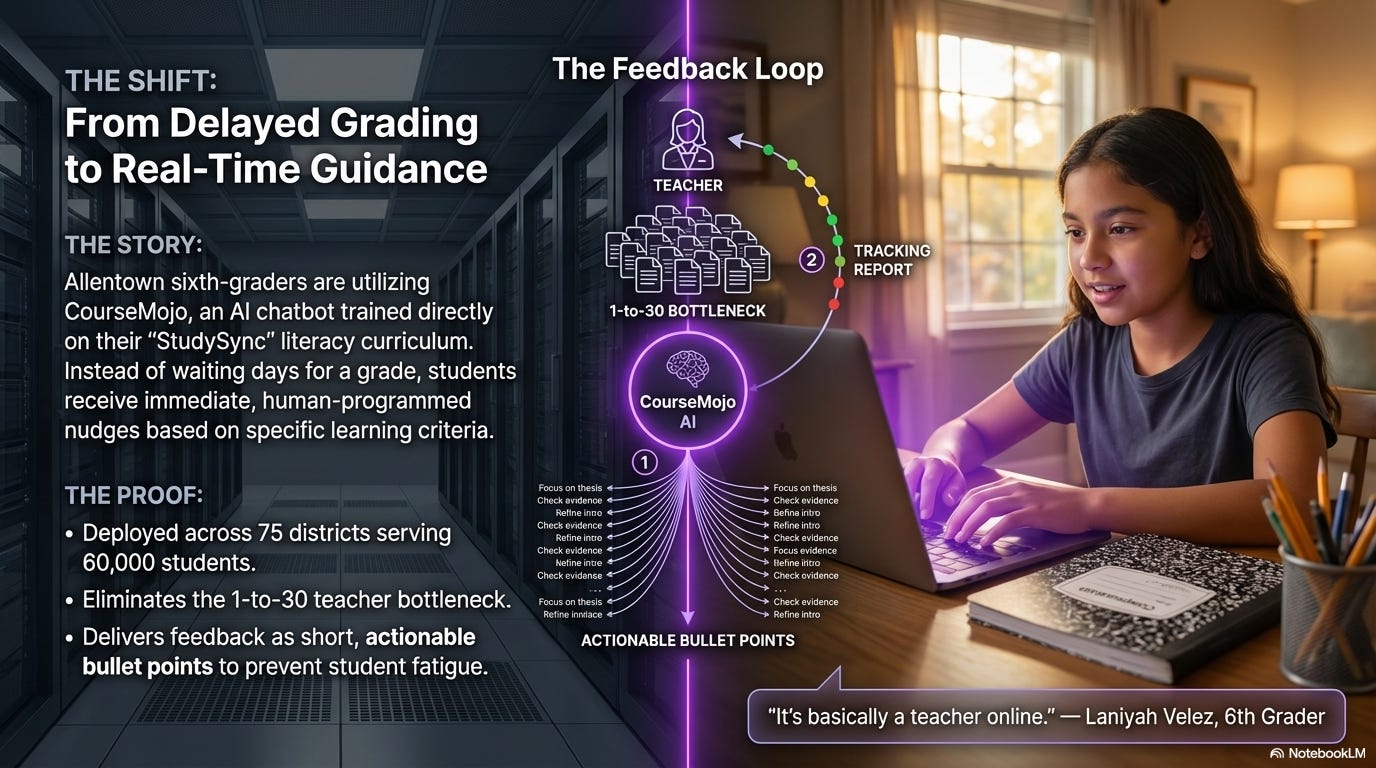
Allentown School District in Pennsylvania deployed CourseMojo, an AI-powered chatbot, across its sixth-grade language arts classrooms. What sets it apart from generic AI tutors: CourseMojo was trained on the district’s actual literacy curriculum, StudySync. When students respond to reading comprehension questions or writing prompts, the AI matches their answer against criteria that human educators wrote, then delivers feedback from a bank of human-produced responses. It’s not generating answers on the fly. It’s sorting student work against a rubric and responding with guidance that teachers designed.
The classroom results are unusually candid for an ed-tech story. Some students found the tool genuinely helpful, saying it helped them get unstuck while writing or describing it as basically having a teacher online. But students also reported frustration: feedback sometimes felt vague or repetitive, and classmates who entered similar answers occasionally received different responses, which confused group work.
Teachers are presented a different picture, and it’s one that keeps them firmly in the loop. The system flags students who may need a one-on-one conference and identifies class-wide misconceptions in real time. During one lesson, CourseMojo signaled that many students were confusing “being a trailblazer” with “being skilled,” and the teacher paused the room to address it on the spot. Teachers can track individual responses through a dashboard, see how many times each student attempted a question, and surface strong answers worth sharing with the class. The AI handles the first pass on student work so teachers can focus their attention where it matters most: the students who need direct help and the patterns that require instructional adjustment.
The $45,000 implementation cost (licensing, coaching, and setup) is covered by Digital Promise, a nonprofit supporting education technology. CourseMojo currently serves nearly 60,000 students across 75 districts nationally, and Allentown is considering expansion to seventh and eighth grade.
No quantitative outcome data exists yet. No test score improvements, no literacy gains. This is explicitly year one, and the article is honest about that. But the operational detail is rich: a tool that’s embedded in the actual curriculum rather than layered on top of it, iterated in response to real student and teacher feedback, and reported on with enough candor to include the parts that aren’t working yet. That combination is worth following.
Key Stakeholders
Allentown School District
CourseMojo
Digital Promise
Seeing Faults Before the Fire: Why AI Is Moving to the Grid’s Edge
Power grids have always been monitored from the center. Sensors and meters collect data across the distribution network, route it to a utility’s operations center, and analysts decide what to do. That works when the grid is relatively simple and threats develop slowly enough for the data to make the trip.
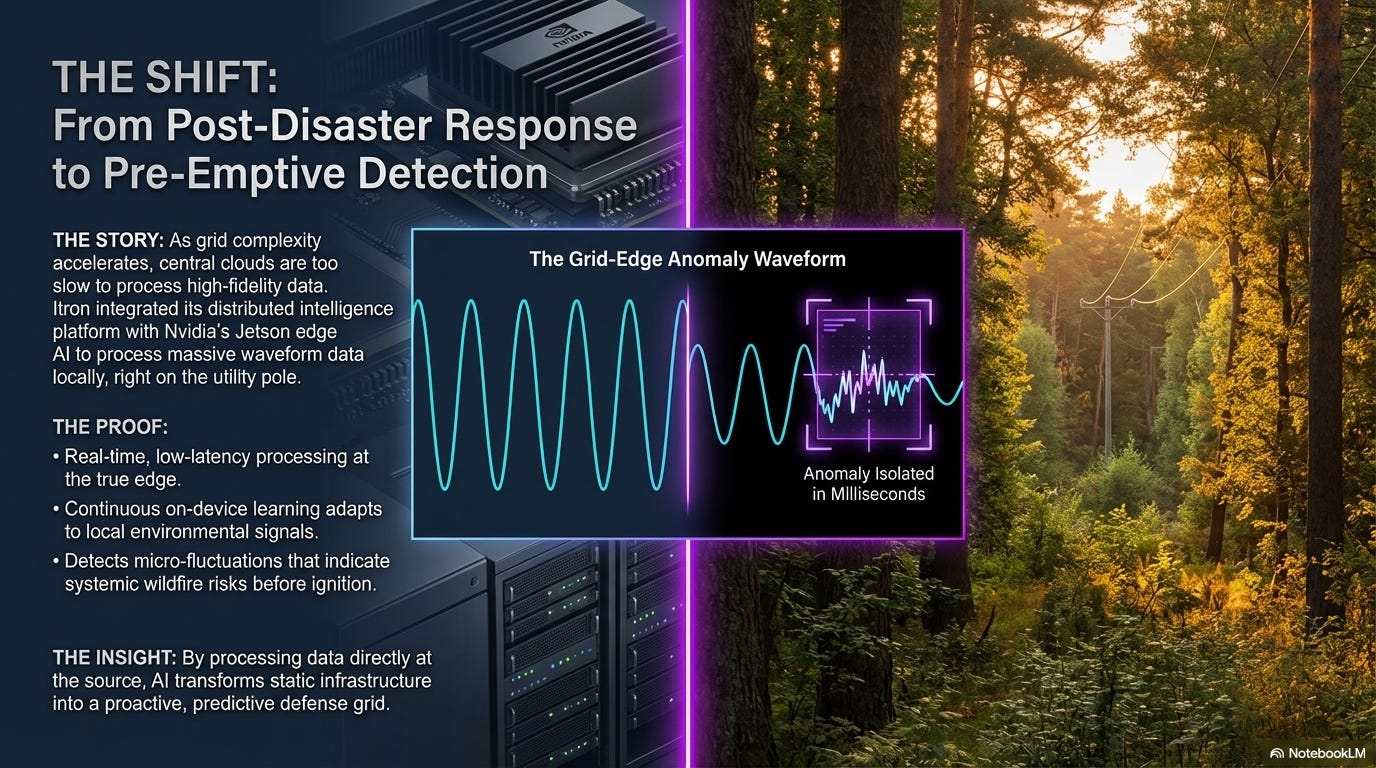
The grid is getting more complex. A traditional grid moves electricity in one direction: from a power plant to your house. But homes with rooftop solar sometimes consume power and sometimes push it back onto the grid, reversing the flow depending on weather, time of day, and cloud cover. EVs add large, unpredictable load spikes when people plug in. Battery storage systems charge and discharge on their own schedules. None of this increases total demand the way a new factory would. It increases the number of points where conditions change quickly and unpredictably, and centralized monitoring systems weren’t designed for that. By the time sensor data travels to a utility’s operations center, gets analyzed, and triggers a response, the window for prevention may already be closing.
A recent demonstration by Itron and Nvidia shows one approach to the problem. Instead of sending raw data back to a central server for analysis, their system runs AI directly on the devices already installed across the grid: the meters, sensors, and endpoints that sit at the point where conditions actually develop. The AI processes electrical waveform data on-site, detects anomalies that could indicate equipment faults or emerging wildfire conditions, and learns continuously, recognizing new threat patterns as it encounters them. The insight stays at the edge rather than making a round trip to headquarters.
This is a demonstration, not a deployment. No utility has announced an operational rollout. There are no metrics: no fault detection improvement rates, no latency comparisons, no before-and-after data from a real grid. The source is a trade publication covering what is effectively Itron’s industry announcement. All of that warrants caution.
But the concept is worth paying attention to, because the underlying problem is real and growing. Grid complexity is increasing faster than utilities can hire analysts to monitor it. The May 2024 solar storm, the strongest to hit Earth in over two decades, disrupted GPS systems, degraded high-frequency radio communications, and stressed power grids worldwide. Precision agriculture equipment lost the centimeter-level GPS accuracy it depends on, forcing farmers to halt planting.
No major blackouts were reported, but the storm was a reminder of how quickly external threats can develop and how dependent grid infrastructure is on systems that a more powerful storm could disable. Wildfire risk in the western U.S. and Australia has made grid monitoring a public safety issue, not just an engineering one. If AI can reliably detect the early signatures of a fault or fire risk at the source, seconds or minutes before a centralized system would catch it, the safety implications are significant.
This is a space worth watching. As deployments emerge, the questions that matter will be straightforward: how much faster does edge detection identify threats compared to centralized monitoring? How many false positives does it generate? And does it actually reduce outages, equipment damage, or fire risk in practice?
Key Stakeholders
The Photo Your Surgeon Hasn’t Seen Yet: Mayo Clinic’s AI Wound Triage
Outpatient surgery is increasingly common. More than 50 million procedures are performed in ambulatory settings each year in the U.S., accounting for roughly 70% of all surgeries. As virtual follow-ups expand, a growing number of care teams are asking patients to submit photos of their surgical wounds through online portals so healing can be monitored remotely. The system depends on someone reviewing those photos quickly enough to catch a problem before it becomes serious.
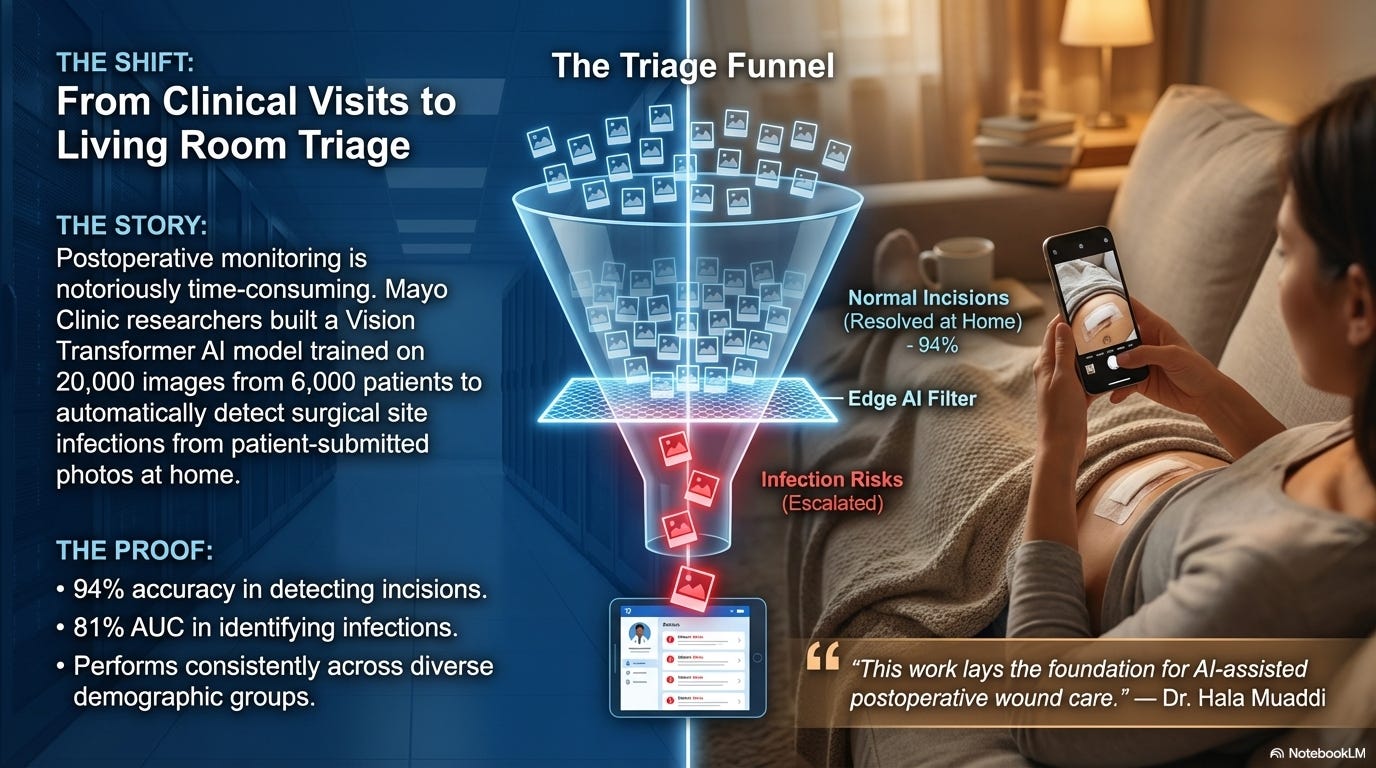
Right now, reviewing those photos is a manual process. Clinicians look at each image individually to assess whether a wound is healing normally or showing signs of infection. The researchers behind this study describe the process as time-consuming and note that it can delay care, particularly as outpatient procedures and virtual follow-ups become more common.
Researchers at Mayo Clinic built an AI system designed to triage those photos automatically. Published in the Annals of Surgery, the study describes a two-stage model that first identifies whether the image contains a surgical incision (94% accuracy), then evaluates whether that incision shows signs of infection, correctly distinguishing between infected and non-infected wounds 81% of the time. It was trained on more than 20,000 images from over 6,000 patients across nine Mayo Clinic hospitals, and the researchers report consistent performance across diverse patient groups, meaning it didn’t perform better for some demographics than others.
The tool is still in the research phase. The researchers are clear that prospective validation studies are underway and further testing is needed before clinical use. An 81% accuracy rate for infection detection is a solid starting point, but it’s not yet at the level needed for a system that patients would depend on to catch a worsening wound. A missed infection carries real consequences, and the accuracy bar for deployment in this context is high.
What makes the research worth covering now: the problem it targets is growing alongside the trend toward outpatient surgery and virtual follow-ups. If the model’s accuracy improves through ongoing validation, it could become a frontline screening tool that routes clinical attention to the wounds that need it most, particularly for patients in rural areas or resource-limited settings where an in-person follow-up isn’t easy to get.
Article
Ambulatory Surgery Centers Trend (ExactRx)
Acute Hospitalizations Following Outpatient General Surgery (NCQA)
Key Stakeholders
Takeaway
The fundamental constraint in every story this week is the same one: a person responsible for many can only focus on one at a time. A nurse attending to a patient in Room 12 isn’t watching Room 14. A teacher conferencing with one student isn’t hearing the three others who just got stuck. That’s not a staffing problem or a performance problem. It’s how human attention works.
What these AI tools share is the ability to monitor broadly while the humans monitor deeply. The nurse can give her full attention to the patient in front of her because the radar system is tracking movement patterns in every other room simultaneously. The teacher can pull one student aside for a meaningful conversation because the chatbot is providing feedback to the rest of the class in real time. The utility engineer can focus on the site that needs repair because the AI is processing data from every other endpoint on the grid. And if something does develop, the system alerts them immediately, which means they can focus fully on the task at hand without worrying about what they might be missing somewhere else.
Neither piece works well alone. Continuous AI monitoring without human judgment produces alerts that nobody acts on. Human expertise without continuous coverage produces gaps where things get missed. The value is in the pairing: AI handles the breadth so the human can go deep where it counts.
The same pattern extends well beyond the four sectors in this issue. A child welfare caseworker visits families monthly, but school attendance records, emergency room visits, utility disconnections, and police calls to a household address are all generating data between those visits. A probation officer meets a client every two weeks, but GPS monitor data, check-in compliance patterns, and employment verification records are sitting in systems nobody has the capacity to review across 200 cases simultaneously. An environmental inspector audits a facility quarterly, but continuous discharge monitors and water quality sensors are already tracking conditions between visits. In each case, the data between check-ins already exists. What’s missing is the ability to watch it all at once and flag what matters.
As AI agents continue to evolve, the number of data points that can be monitored between visits will only grow, producing a more complete and continuous picture of what’s actually happening on the ground. The gap between check-ins doesn’t have to be a blind spot.
The evidence behind these tools is at different stages, from self-reported results across multiple sites to peer-reviewed research not yet in clinical use to a demonstration with no deployment data at all. That range is worth acknowledging. But the underlying pattern is already clear enough to pay attention to: problems don’t have to get lost in the gaps anymore. With these tools, the practitioners own the edge.
Share the Knowledge
If you know someone in senior care, education, healthcare, or infrastructure who’s trying to figure out where AI fits into their work, forward this issue to them. These stories are a good starting point for that conversation.
And if your organization has gaps between check-ins where things are getting missed, I’d like to hear about it. Reply and tell me what’s falling through the cracks. I’m always looking for the next story.